Typical measurement displays are shown for the basic Spectrum Analyzer mode of the MS272xB. Note that the images shown in this manual may be different from any images that are displayed on your Spectrum Master.
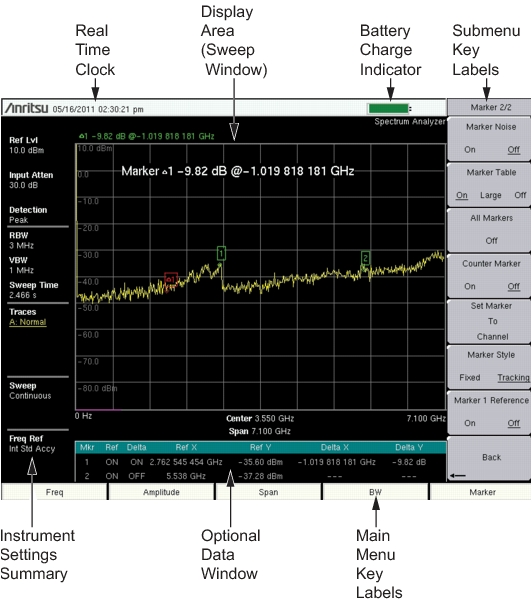
Figure 1‑6 illustrates some of the key information areas of the MS272xB display. For more detailed key descriptions of the Spectrum Analyzer mode, refer to the Spectrum Analyzer Measurement Guide (available on the Handheld Instruments Documentation Disc). Also refer to Measurement Guides, for a complete list of measurement guides.
 |
